Multi-Channel BI Cube and Executive Dashboard Design/Development
Business Objective
A large entertainment company based in Burbank, CA had been spending a substantial amount of time each month manually collecting data from various sources and developing Digital Video Performance Reports that summarize key usage and advertising revenue metrics from across ten different business units and numerous websites. This labor-intensive process was prone to inconsistent application of business rules and errors were introduced during the data consolidation process. This resulted in late and unreliable information within the reports.
Our client wanted help from the eSage Group building automated feeds and business logic from these various data sources, consolidating the data in a new analytics cube and building various reports and dashboards to present the performance metrics is a usable format.
The aggregated data includes feeds on Omniture website analytics metrics, long and short term video ad inventory/performance, display ad inventory/performance and user registration data.
Solution
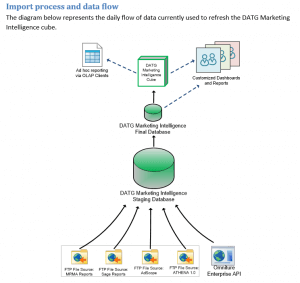
Using our extensive business domain knowledge and Microsoft Business Intelligence technologies, eSage Group automated the data feeds from multiple source systems into newly designed staging and production databases, normalized the data and published it to a newly designed Business Intelligence Analysis Cube. eSage Group then created various Dashboards to allow the executives of 10 separate business units to view aggregate or detailed metrics on: website video viewing performance; unique/returning users; registrations; video and digital advertising performance and revenue performance against goals.
Results
The new solution eliminated hours of manual processing as well as the associated errors. Working with the key stake holders, eSage developed a system that is easily understood by and accessible to all intended users. eSage also identified various data integrity and validation issues, thereby ensuring accurate data necessary for our client’s executives to make sound business decisions. The new Analysis cube developed by eSage Group allowed for flexible ad-hoc reporting, easy addition of additional measures to existing reports, incorporation of critical revenue generation metrics and development of detailed user profile and market segmentation reports.
Deliverables
- Data loading routines/ETL’s
- Design and development of Staging and Production databases
- Customer Datamart/Analysis Cube
- Summary and ad-hoc reporting for 10 different business units
- Production support