Do Pop Up Stores Convert Online eCommerce Customers?
Business Objective
An Online Retail client opened their first Pop Up store but didn’t know if the store had succeeded in generating sales among customers who lived in the area but never visited the store. The client opened this store in a particularly dense metropolitan area, which was their leading area of sales at the time of opening, and wanted to understand the potential impact of the new store on “branded sales”.
Solution
-
We found that in this scenario, there was no way to run a true experiment to test the impact of the new store on “Branded Sales”. There is no real way to do a point-in-time controlled experiment of a single region (unless we figure out how to break some pretty important physics). Think about it like this, if I put up a billboard along a highway how could I perform an experiment on this? There is no way to control the audience that drives by, and for our stores, there is no way to control who walks by or walks in.
-
Given this, we defined an approach that gave us the ability to simulate an experiment, using data collected during that time. We leveraged some amazing work by Jens Hainmueller et al. to help us define our experiment. Hainmueller and his colleagues determined that there was a way to provide a “Synthetic Control” for these kinds of regional experiment scenarios, by using other regions where data was collected. This Synthetic Control group is meant to simulate those customers who never saw the Pop Up Store. So, by comparing some predictive features between the Experimental Region, and the Surrounding Regions (we used Revenue, Order Volume, and Unique Users as controlling features), a linear combination of Surrounding Regions can be used to approximate the Post-Treatment period version of the Experimental Region. Once the Synthetic Control group has been formed, the method can then compare the outcomes of the Experimental Region compared to the calculated outcomes of the Synthetic Control group.
- In addition to the analysis, we defined our KPI goal for the project to be Branded Sales. After discussing at length with our stakeholders, we landed on a definition that satisfied their needs. We defined “Branded Sales” as purchases by Online Only customers, who had NOT visited the store or placed an order at the store. To achieve this, we filtered out users with traffic within the store’s IP subnets; this both filtered out orders placed in the store with the retailers, orders placed within the WiFi Zone of the store, and Users who had visited the store and browsed online. As with all filters, we accepted that this wouldn’t catch everything—like the user on a mobile network, and other potentially unthought of possibilities.
Results
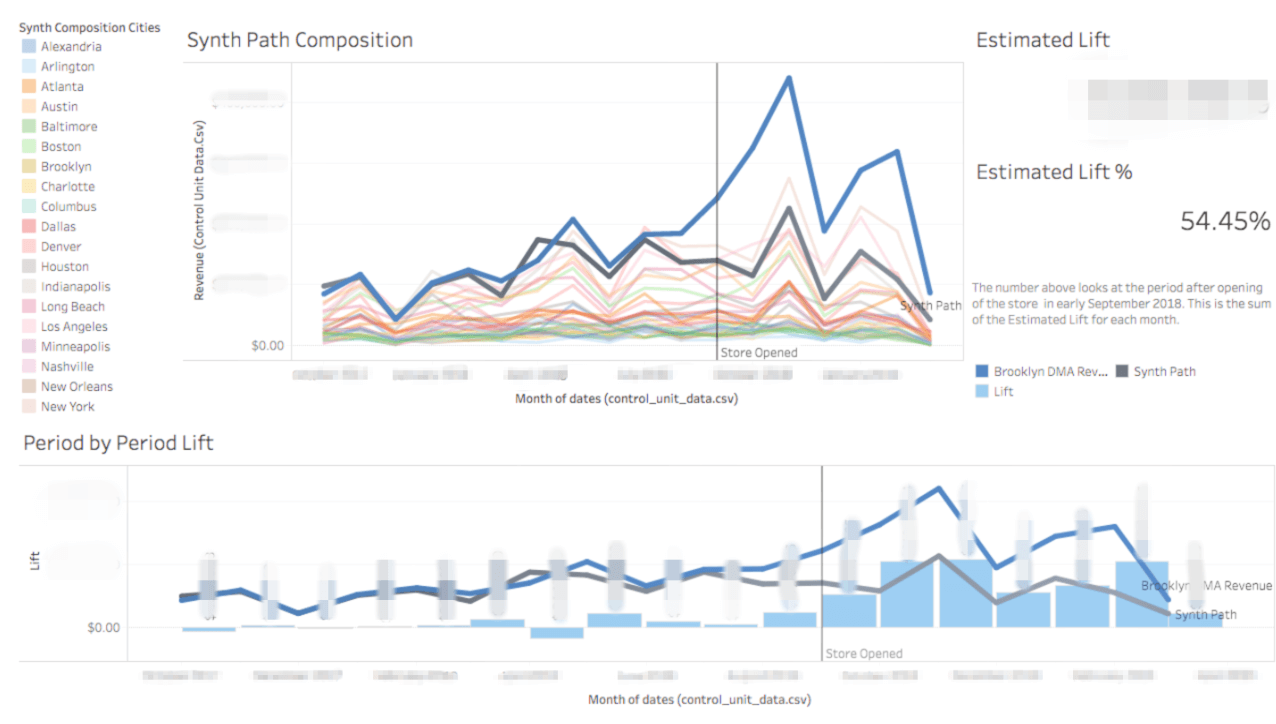
- Once we did the math and performed the analysis, we found that Branded Sales increased by 56% in the months following the opening of the Store. We found this resulted in an increase of revenue impact over 1 million dollars.
- With these insights and the model, we determine that another Pop Up store should be opened elsewhere.
- We placed the results in a Tableau Dashboard to update the results of the simulation over time.
- The report continued updating by CRON Scheduling the simulation code to deliver data to a Redshift Table.
Deliverables
- Automated Tableau Dashboard
- R Code Simulation Model scheduled with Updates
- Presentation and report to deliver the findings
Example of Delivered Dashboard

